Make smarter moves with better data

Track revenue, spot trends, and act faster with analytics made for SaaS and subscription businesses.

Dashboard showing revenue analytics and payment logos, including Visa and Klarna, with a globe in the background.

Powering the world’s best companies

Cyncly logo
Tenable logo
Jamf logo
Pioneer DJ logo
Veeam logo
Red Hat logo
SUSE logo
Sony logo
Cyncly logo
Tenable logo
Jamf logo
Pioneer DJ logo
Veeam logo
Red Hat logo
SUSE logo
Sony logo

Features

Analytics built for subscription models

Bar chart of active subscribers by region with Europe leading, followed by NOAM and APAC. Blue circular background.

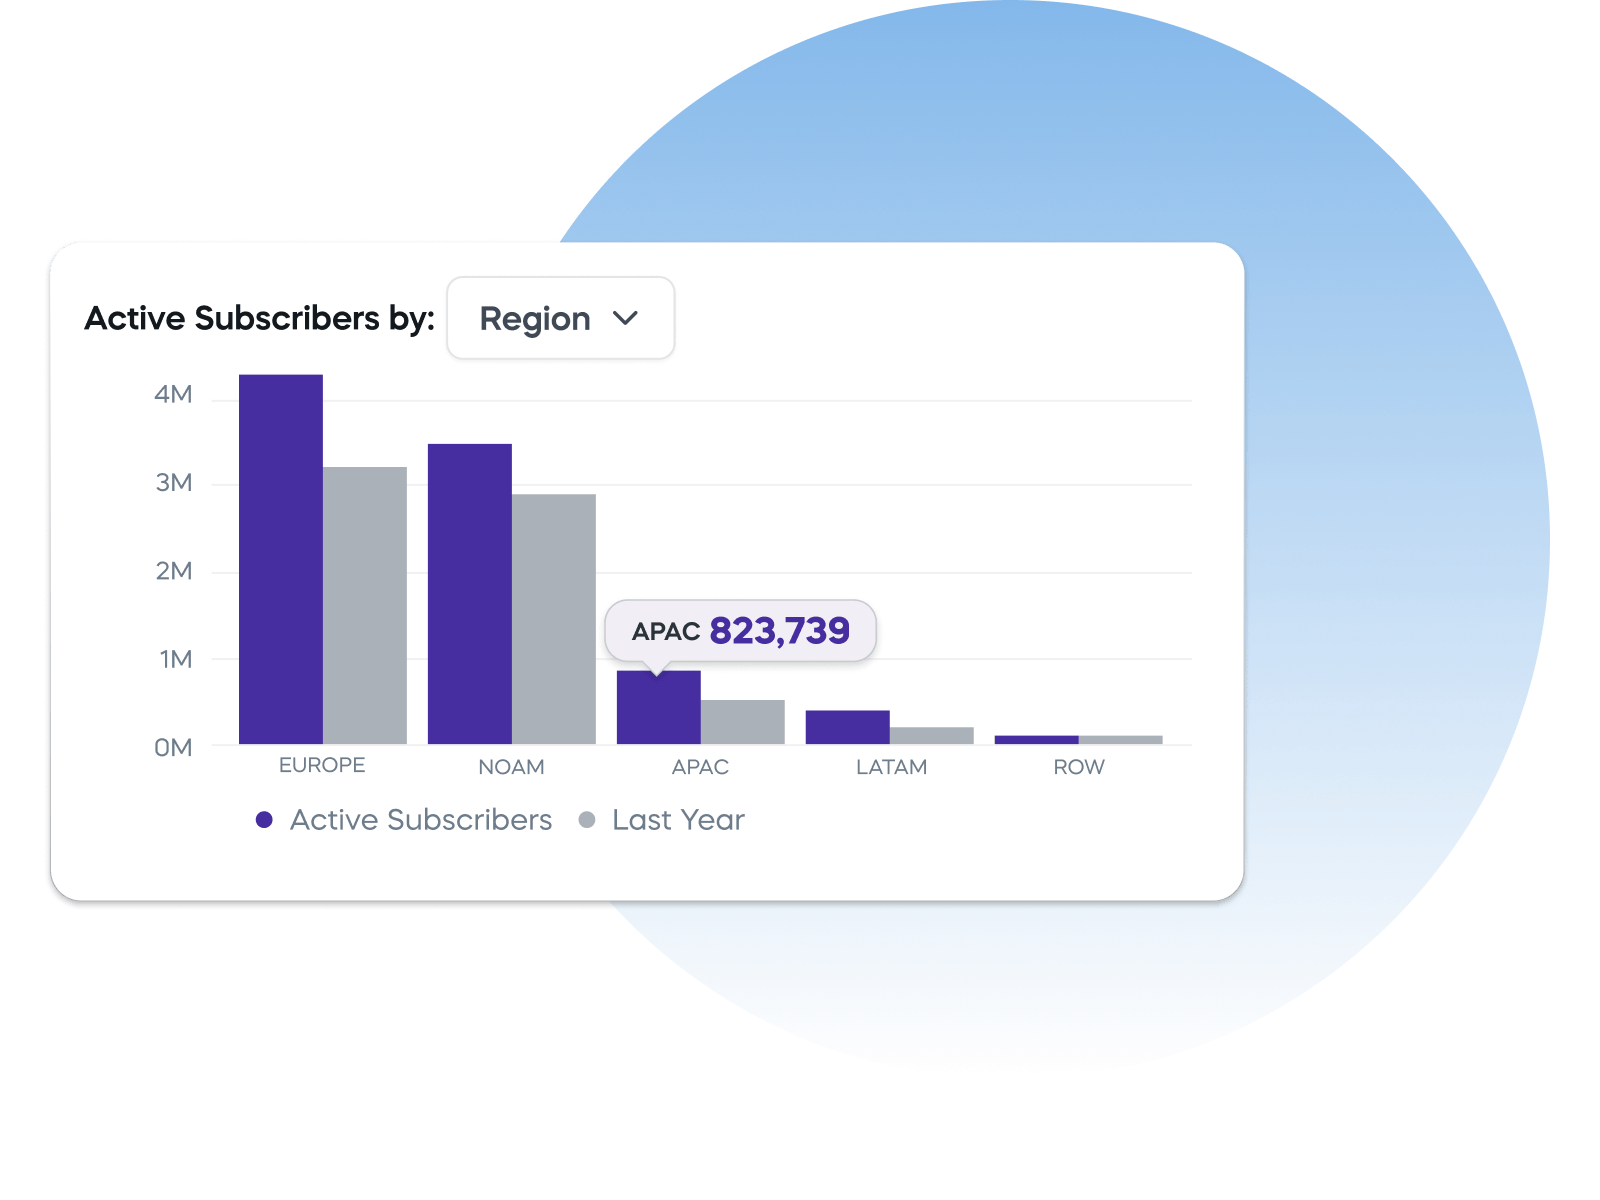
Subscription performance insights

Monitor the health of your recurring revenue — from churn to expansion.

  • Track active subscriptions, upgrades, and downgrades
  • Monitor churn rate and customer lifetime value (CLV)
  • Analyze renewals and co-term activity
  • Visualize net revenue retention (NRR) over time
Learn more
Line graph showing purchase authorization rate at 95%, with a noted difference of 92% and 76% without retention tools.

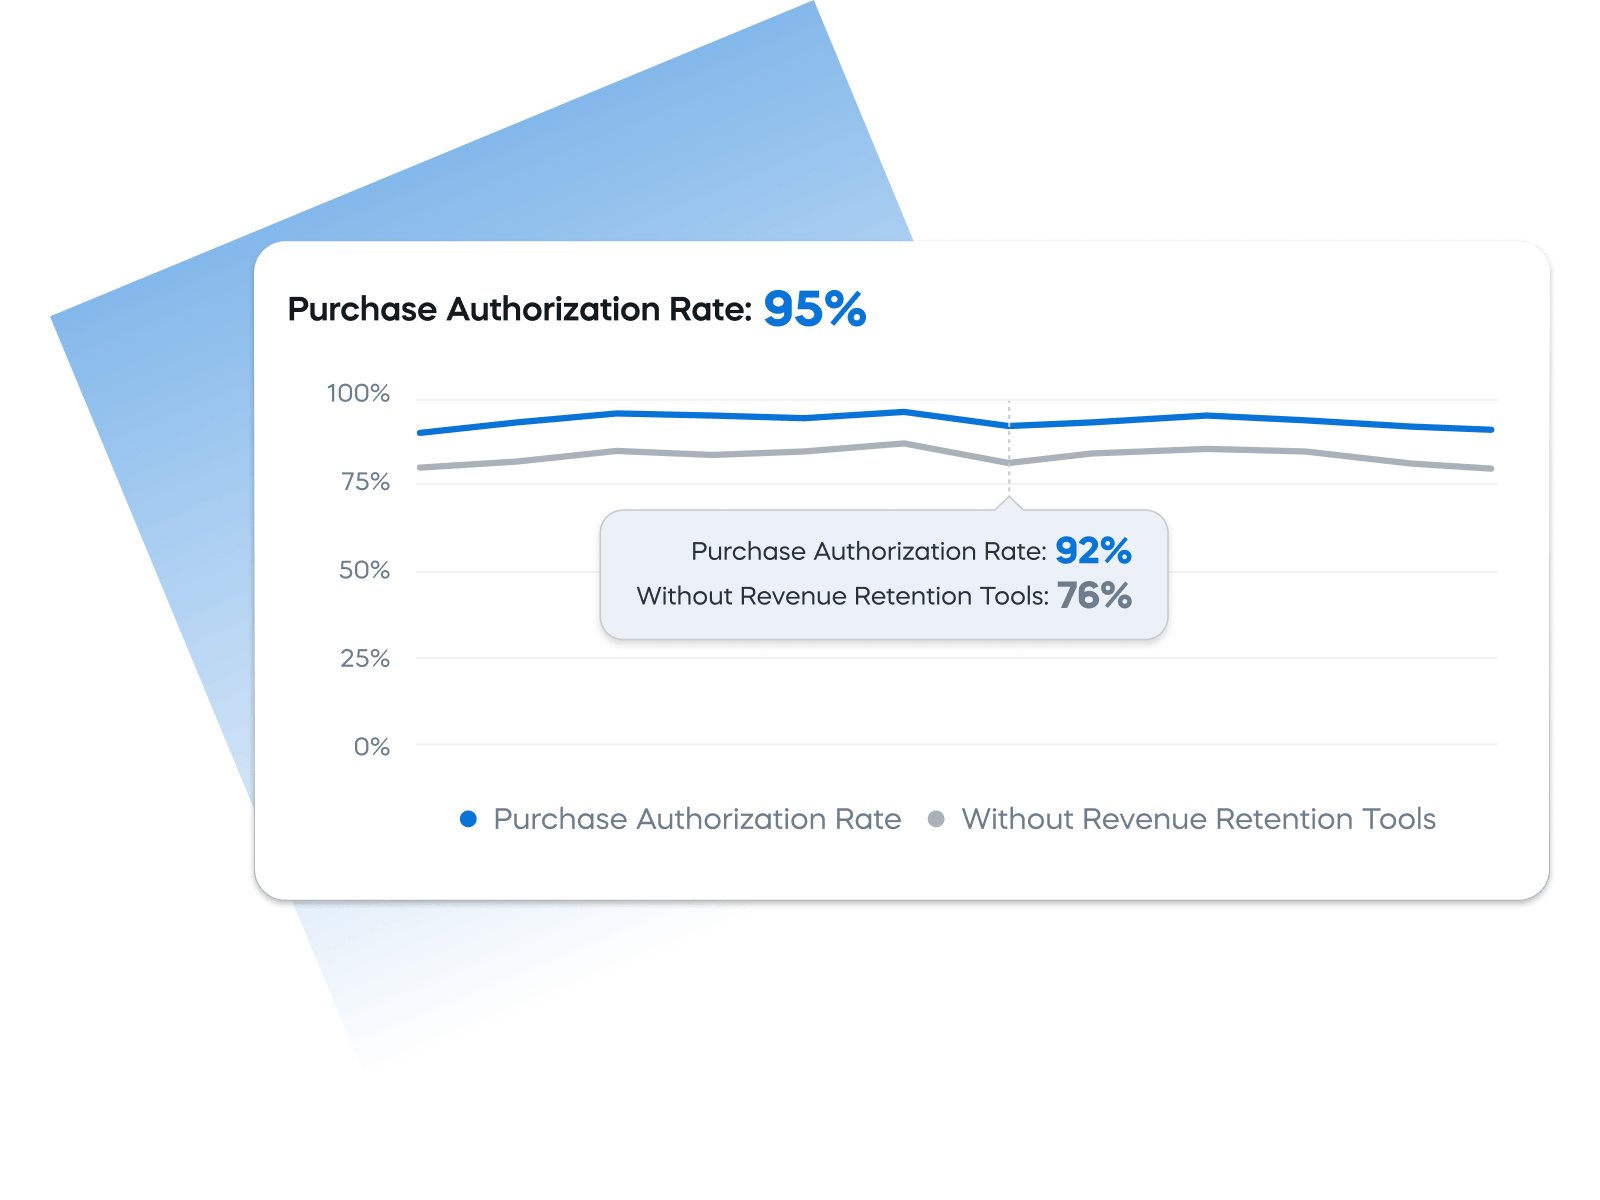
Payment & transaction analytics

Understand how customers pay and why transactions succeed (or fail).

  • View success rates by payment method and region
  • Identify high-risk payment failure patterns
  • Monitor chargeback rates and refund trends
  • Optimize payment method mix for higher conversions
Learn more
Line graph showing renewal rate at 80% with a forecast of 90%, featuring blue and purple trend lines.

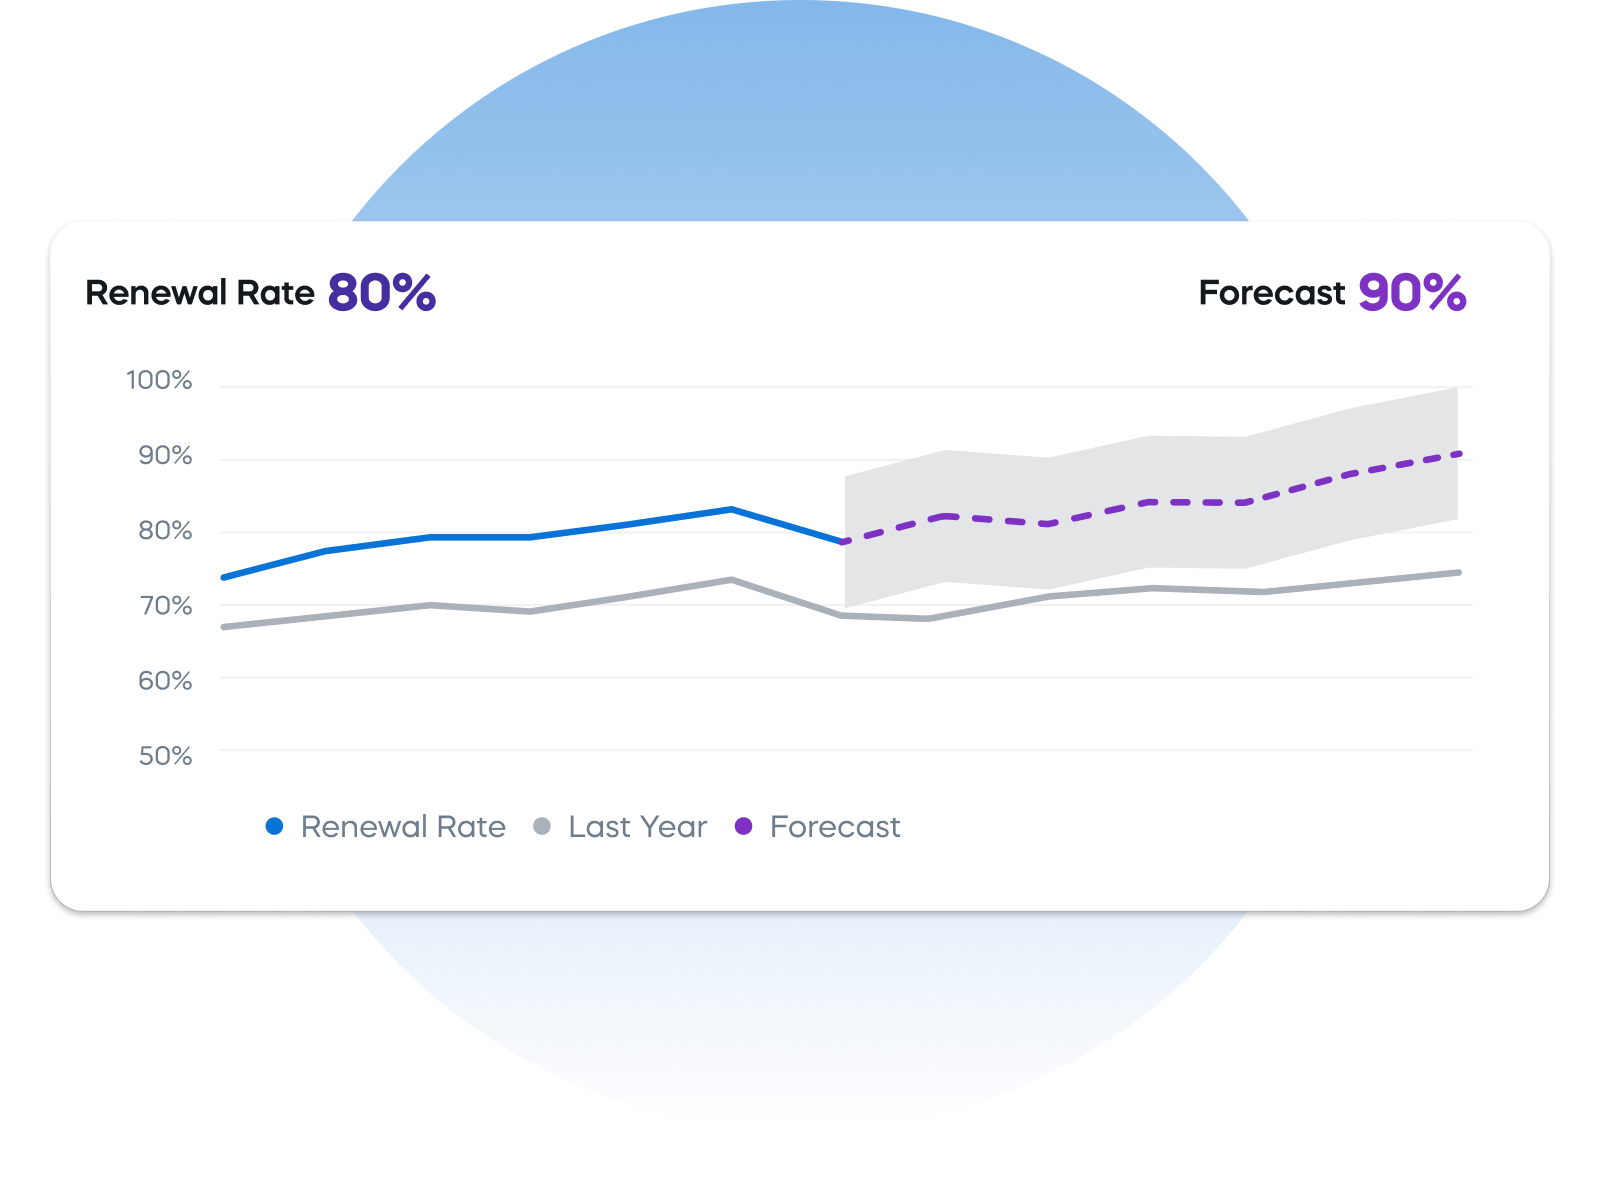
AI-powered advanced insights

Go beyond dashboards with forecasting and advanced reporting tools.

  • Predict revenue and renewal performance
  • Benchmark subscription KPIs against industry peers
  • Get alerts when key metrics spike or drop
  • Discover patterns driving unexpected results
Learn more
Report builder screen with filters for client, currency, product, and recurrence, displaying net revenue table.

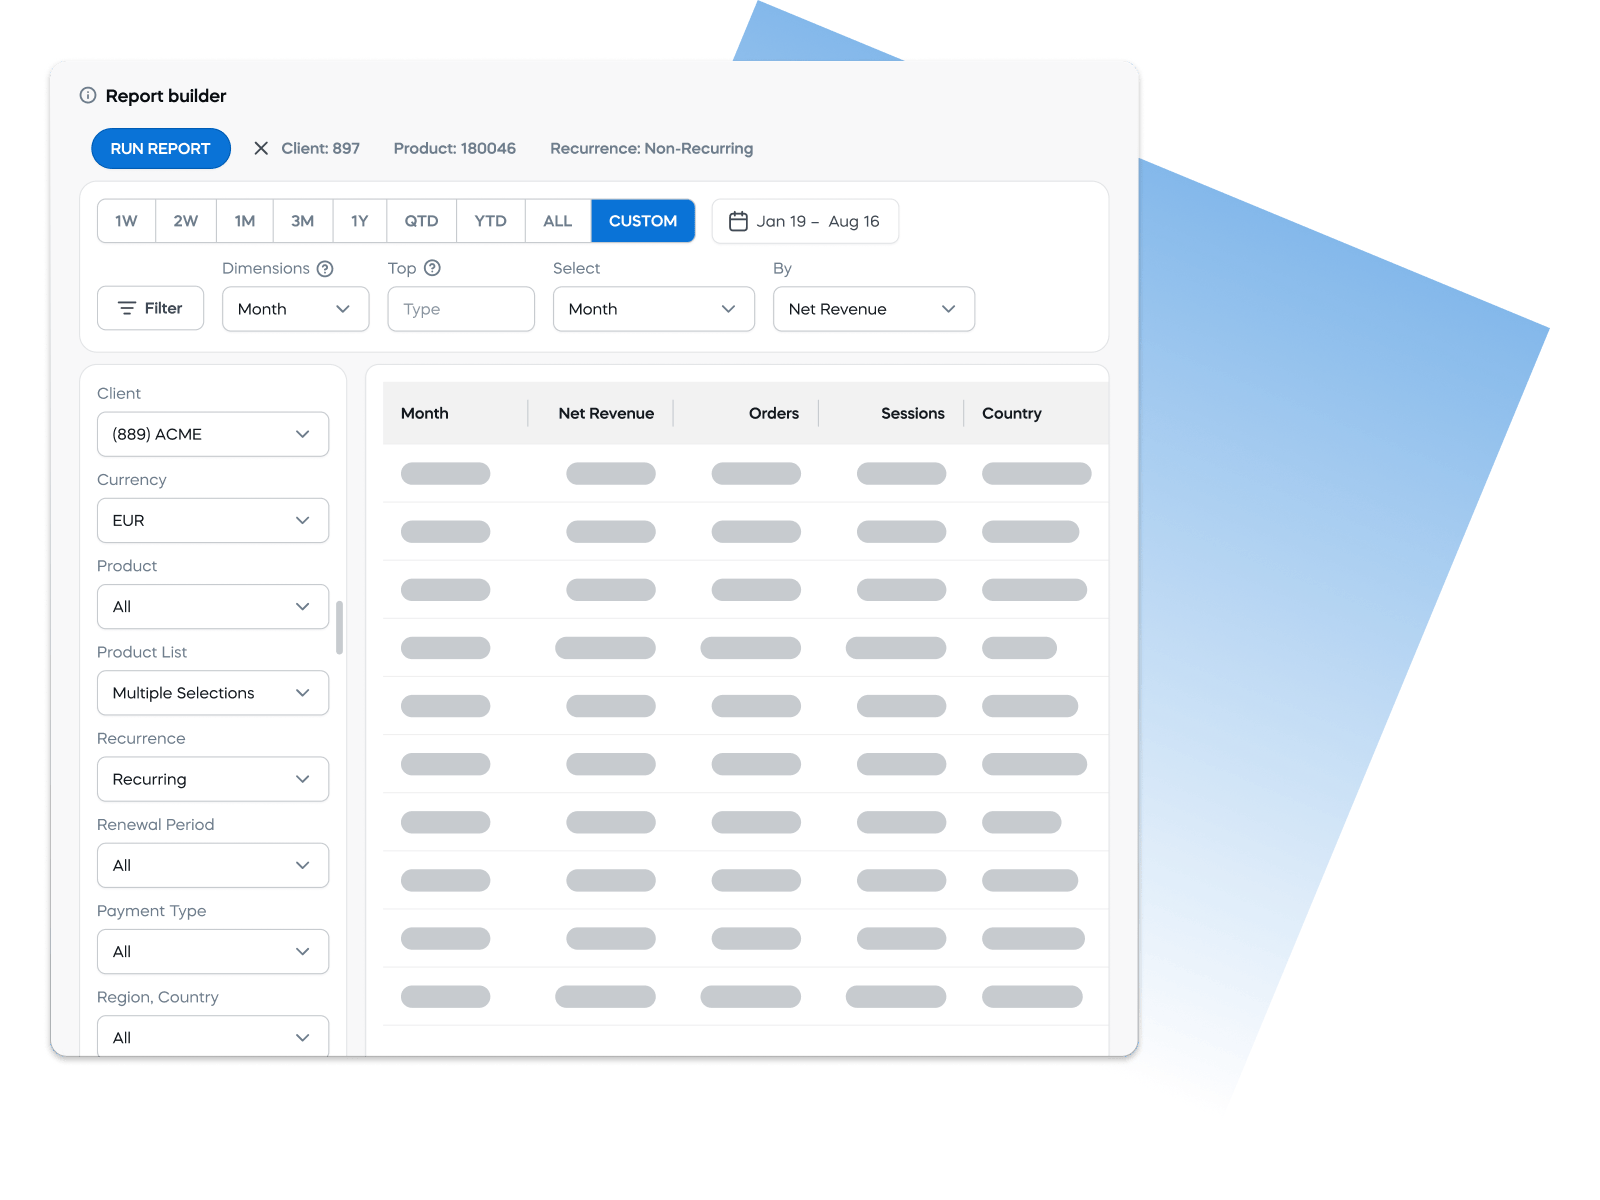
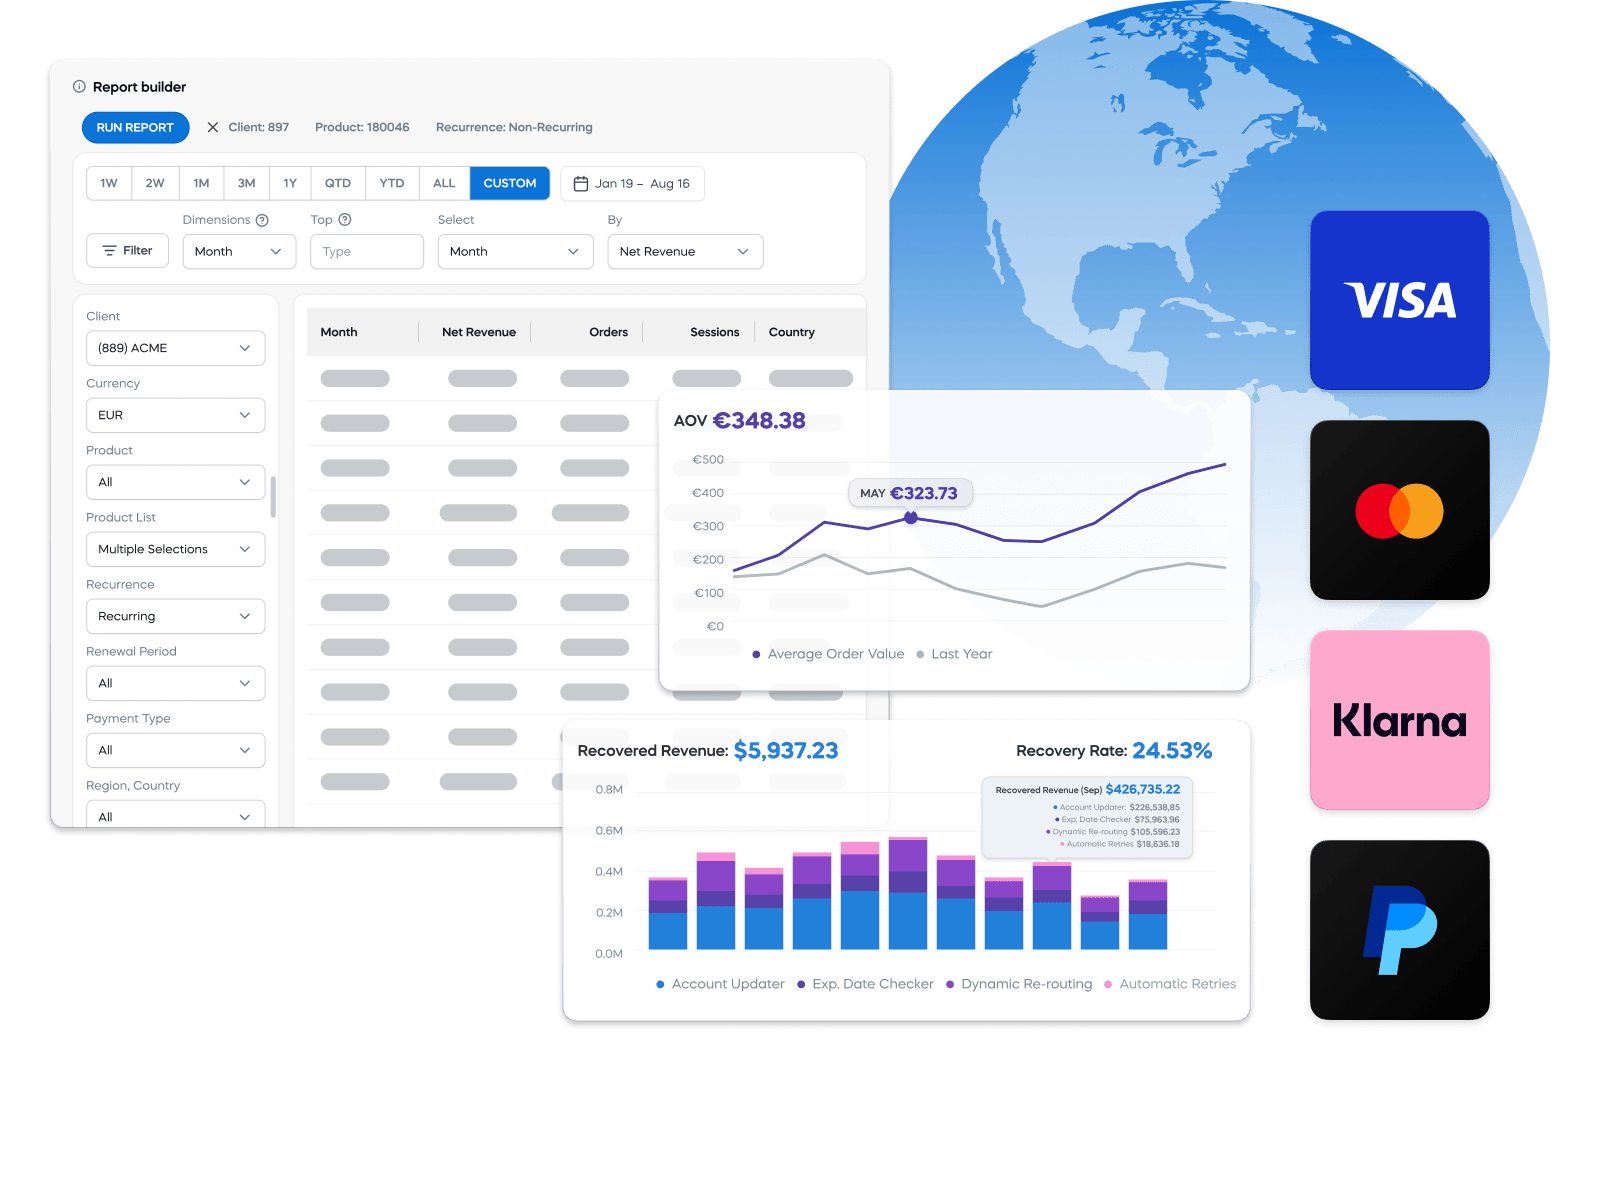
Custom report builder

Create tailored reports with the exact KPIs, filters, and formats your teams need.

  • Drag-and-drop interface for building reports
  • Filter by region, product, channel, and more
  • Exportable formats for exec-ready views
  • Schedule recurring delivery to internal stakeholders
Learn more
Checkout interface for Audio Farm with payment options, transaction details, and partner logos like Workato and Salesforce.

Seamless data integrations

Sync your data wherever you need it, without messy exports or IT delays.

  • Native integration with Snowflake for data sharing
  • API-based access to all reporting metrics
  • Real-time sync with BI tools through our Integration Hub, powered by Workato
  • Create structured pipelines for downstream analytics
Learn more
Bar chart of active subscribers by region with Europe leading, followed by NOAM and APAC. Blue circular background.
Line graph showing purchase authorization rate at 95%, with a noted difference of 92% and 76% without retention tools.
Line graph showing renewal rate at 80% with a forecast of 90%, featuring blue and purple trend lines.
Report builder screen with filters for client, currency, product, and recurrence, displaying net revenue table.
Checkout interface for Audio Farm with payment options, transaction details, and partner logos like Workato and Salesforce.

We offer subscription analytics (churn, MRR, ARR, etc.), payment and transaction analytics (authorization rates, refunds, chargebacks, etc.), and advanced AI-powered insights (forecasting, benchmarking, and anomaly detection) to give you a full view of your business.

It is. Our system automatically flags and explains unusual data shifts for fast investigation and action.

Our AI-powered forecasting helps predict revenue growth, churn risk, renewal trends, and more to enable better strategic planning.

Use pre-configured connectors via the Integration Hub, Cleverbridge Webhooks for instant updates, APIs for real-time integrations, and Snowflake Data Sharing for seamless access to transactional data.

Absolutely. Our self-service reporting platform allows you to create custom dashboards, apply filters, and automate reporting for deeper insights.

Get the data that drives durable growth