- Resources
- The Cost of Selling Software

The Cost of Selling Software
Every GTM Model Has a Cost. We Benchmarked Them.
New benchmark data on how software companies sell, what each path costs, and what stands in the way of more profitable growth.
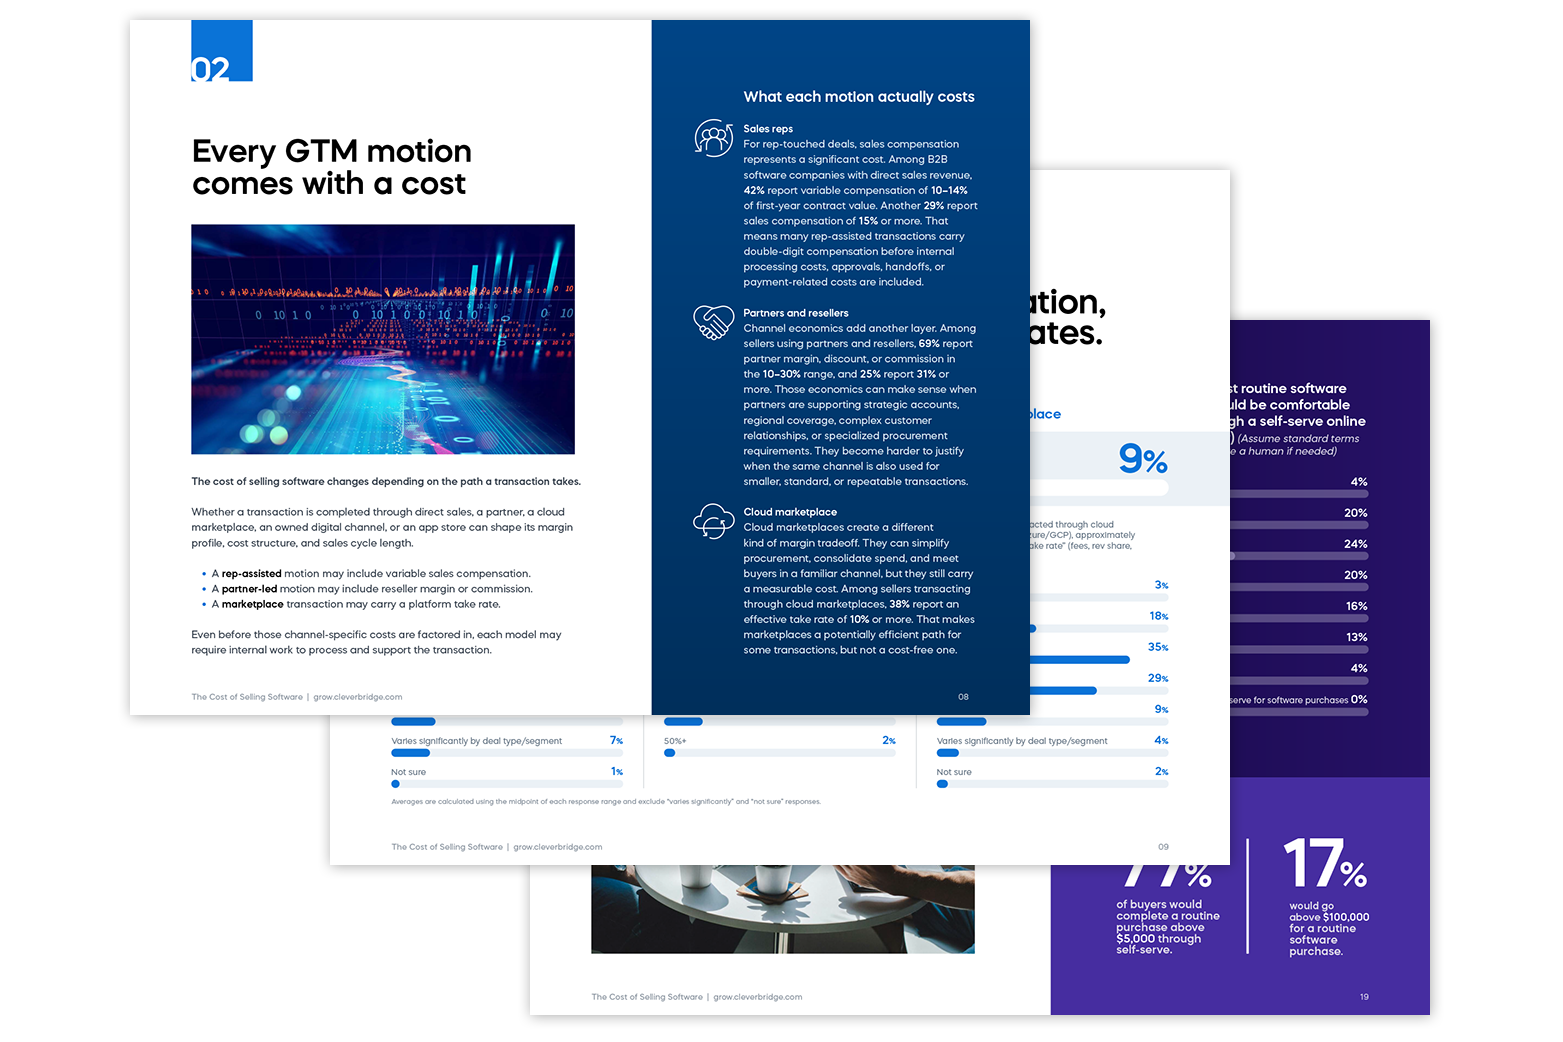
The Cost of Selling Software
New benchmark data on how software companies sell, what each path costs, and what stands in the way of more profitable growth.
Get the full benchmark report
No form fill required.
Software companies have more ways to sell than ever.
Direct sales, channel partners, cloud marketplaces, owned digital channels, and mobile app stores all contribute meaningful revenue across the B2B software market, and that mix keeps expanding as companies scale.
But more paths do not automatically create a more efficient go-to-market model. Each route comes with its own cost structure, sales cycle time, and internal effort, and most companies don’t have a clear way to compare them side by side. That blind spot gets more expensive as the revenue mix grows more complex.
Cleverbridge partnered with Ascend2 Research to benchmark exactly that. The Cost of Selling Software surveys 608 software sellers and 551 software buyers to reveal what each GTM channel actually costs, where routine transactions quietly drain margin, and how buyer expectations are outpacing what most sellers have built.
Cloud marketplaces have edged out direct sales as the most commonly used go-to-market channel: 63% of sellers generate revenue through marketplaces, compared with 61% through direct sales, 55% through owned self-serve channels, 53% through channel partners, and 47% through mobile app stores.
Channel participation grows with scale. Among sellers with $50 million or more in annual revenue, participation is higher across every major channel. That gives larger sellers more flexibility, but it also makes the underlying economics harder to see clearly.
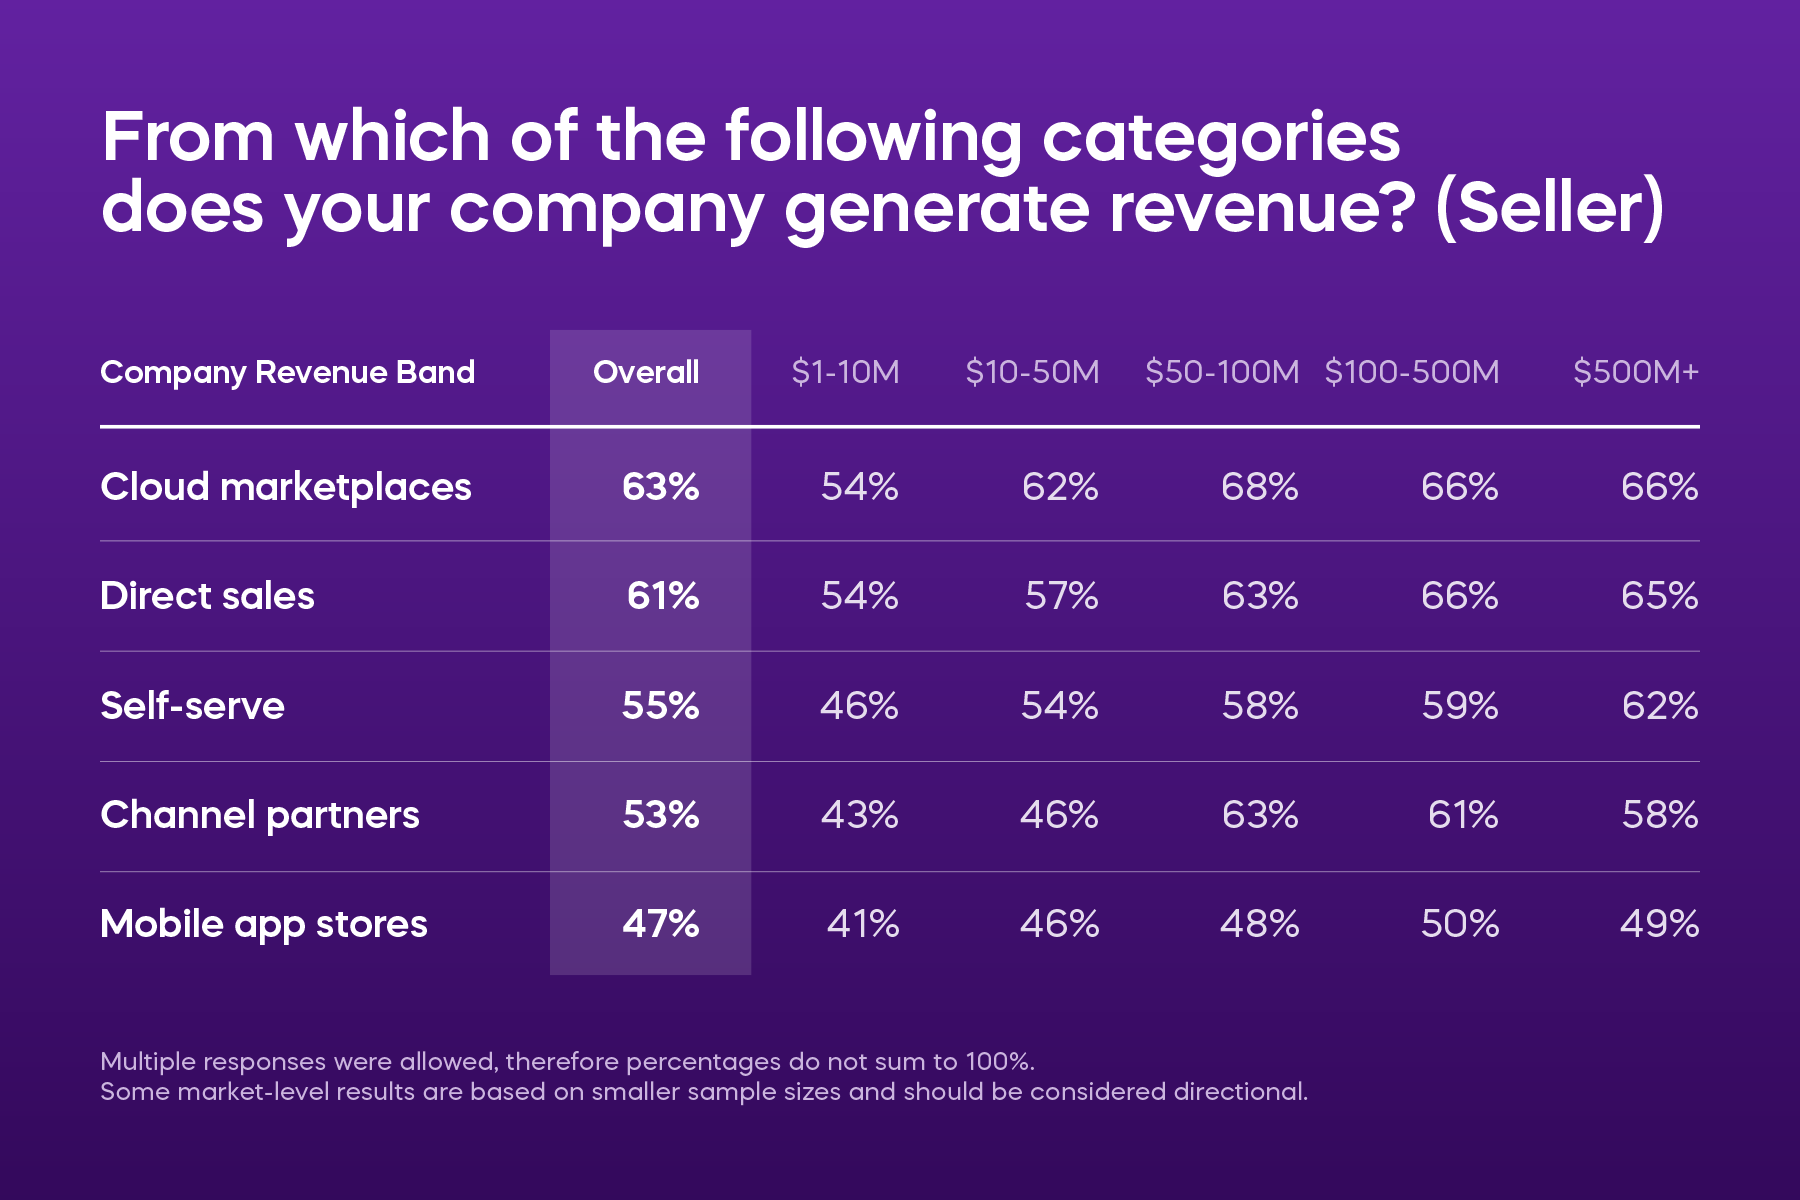
Channel participation climbs with company size — adoption is higher at every revenue band.
The cost of selling software changes depending on the path a transaction takes. For rep-touched deals, software sellers report an estimated average of 13% of first-year contract value paid out in variable sales compensation. Where partners are involved, that estimated average climbs to 24% of deal value in margin, discount, or commission. And among sellers using cloud marketplaces, the estimated average effective take rate is 9%.
None of these costs is a red flag on its own. Sales compensation, partner margin, and marketplace fees can all be justified when they support complex deals, relationship coverage, or committed spend. They get harder to defend when the same high-cost motion is handling standard, repeatable transactions.
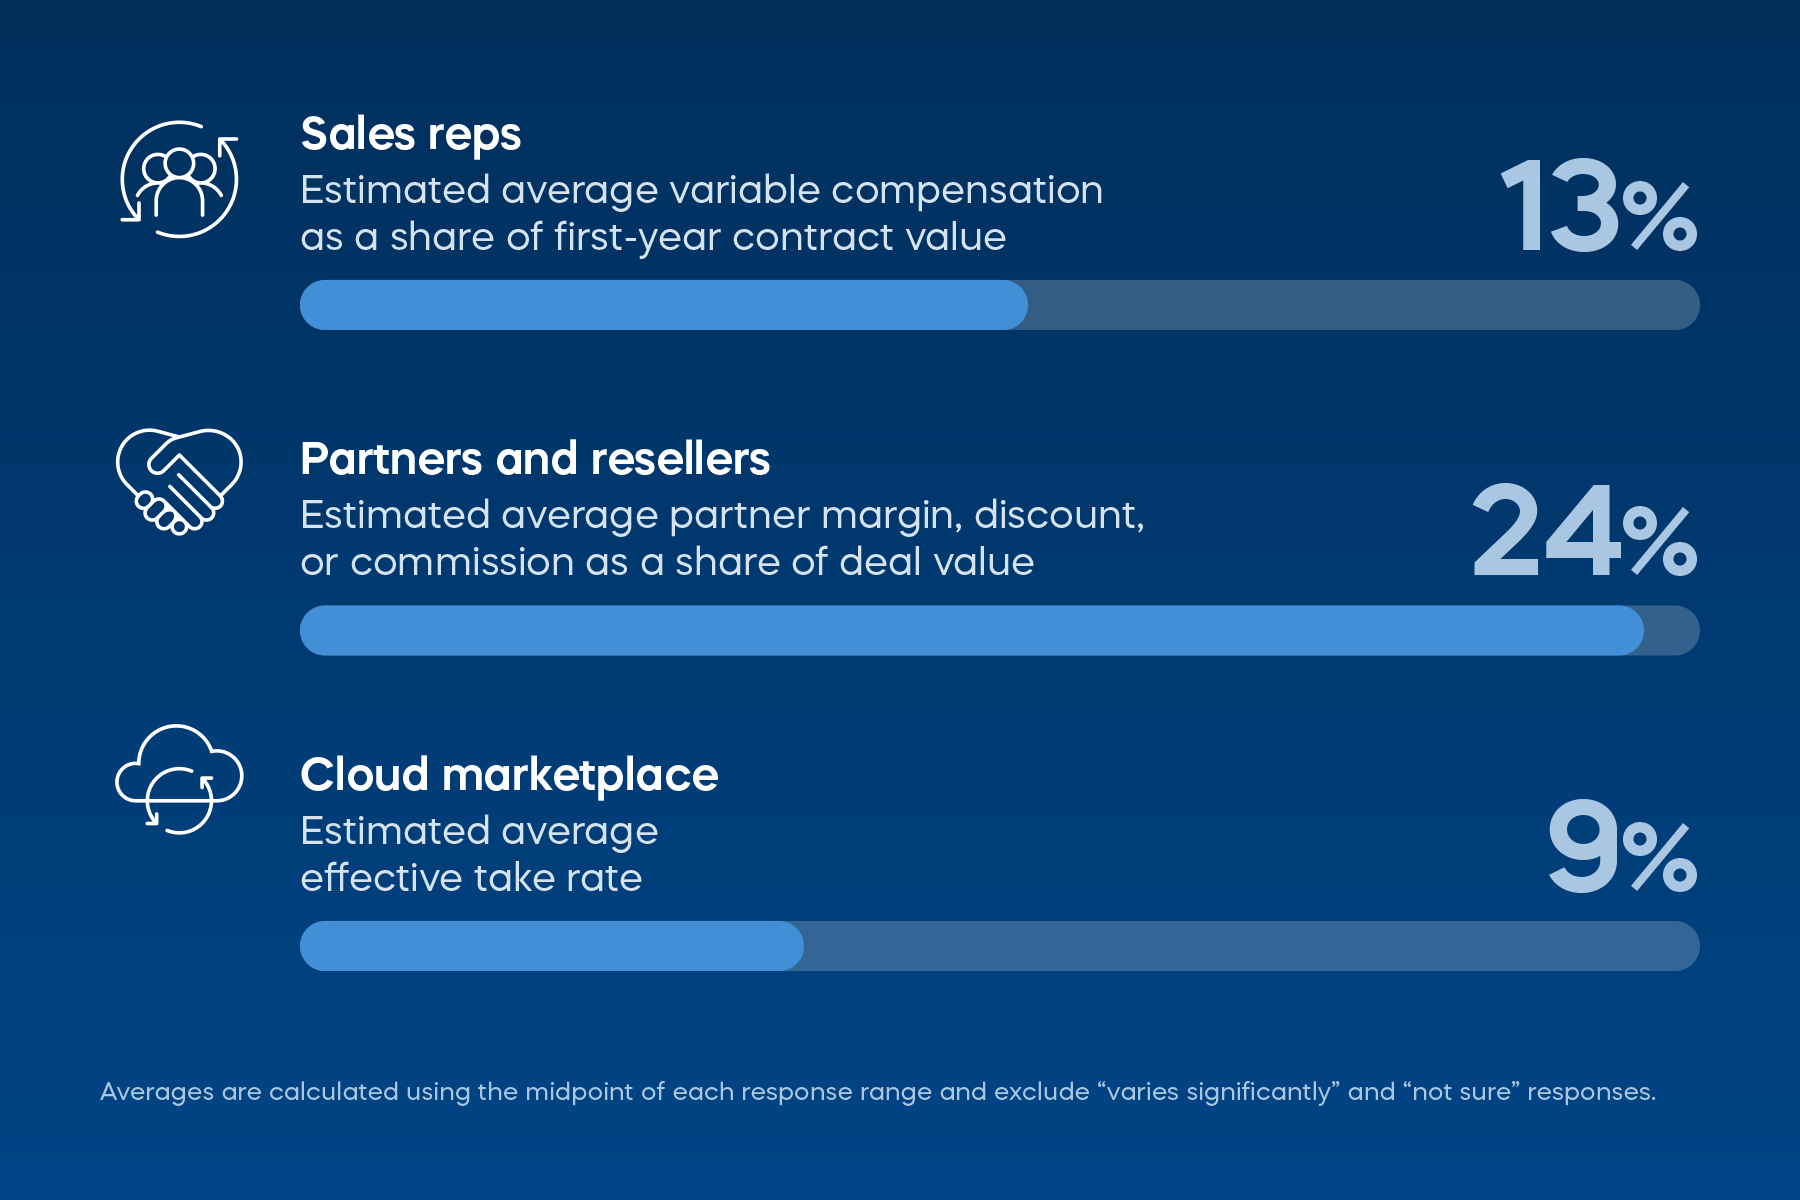
Every path carries a cost. The question is whether the deal's complexity justifies it.
Even low-complexity transactions carry real internal cost. More than half of software sellers report spending $1,000 or more to process a typical “routine transaction” (e.g., renewals, add-ons or extra seats, and smaller new purchases) and over one-third say it takes six hours or more, start to finish. Complex transactions take more time and money overall — 62% cost $1,000 or more, and 47% take six hours or more — but the gap between the two is narrower than most leaders would expect.
That narrow gap isn't a coincidence. Renewals and upgrades — the two most common routine transaction types in the survey — still run through a high-touch or mixed motion 73% and 77% of the time, respectively, rather than a pure self-serve path. This suggests that many standard transactions are still moving through motions more expensive than they need to be.
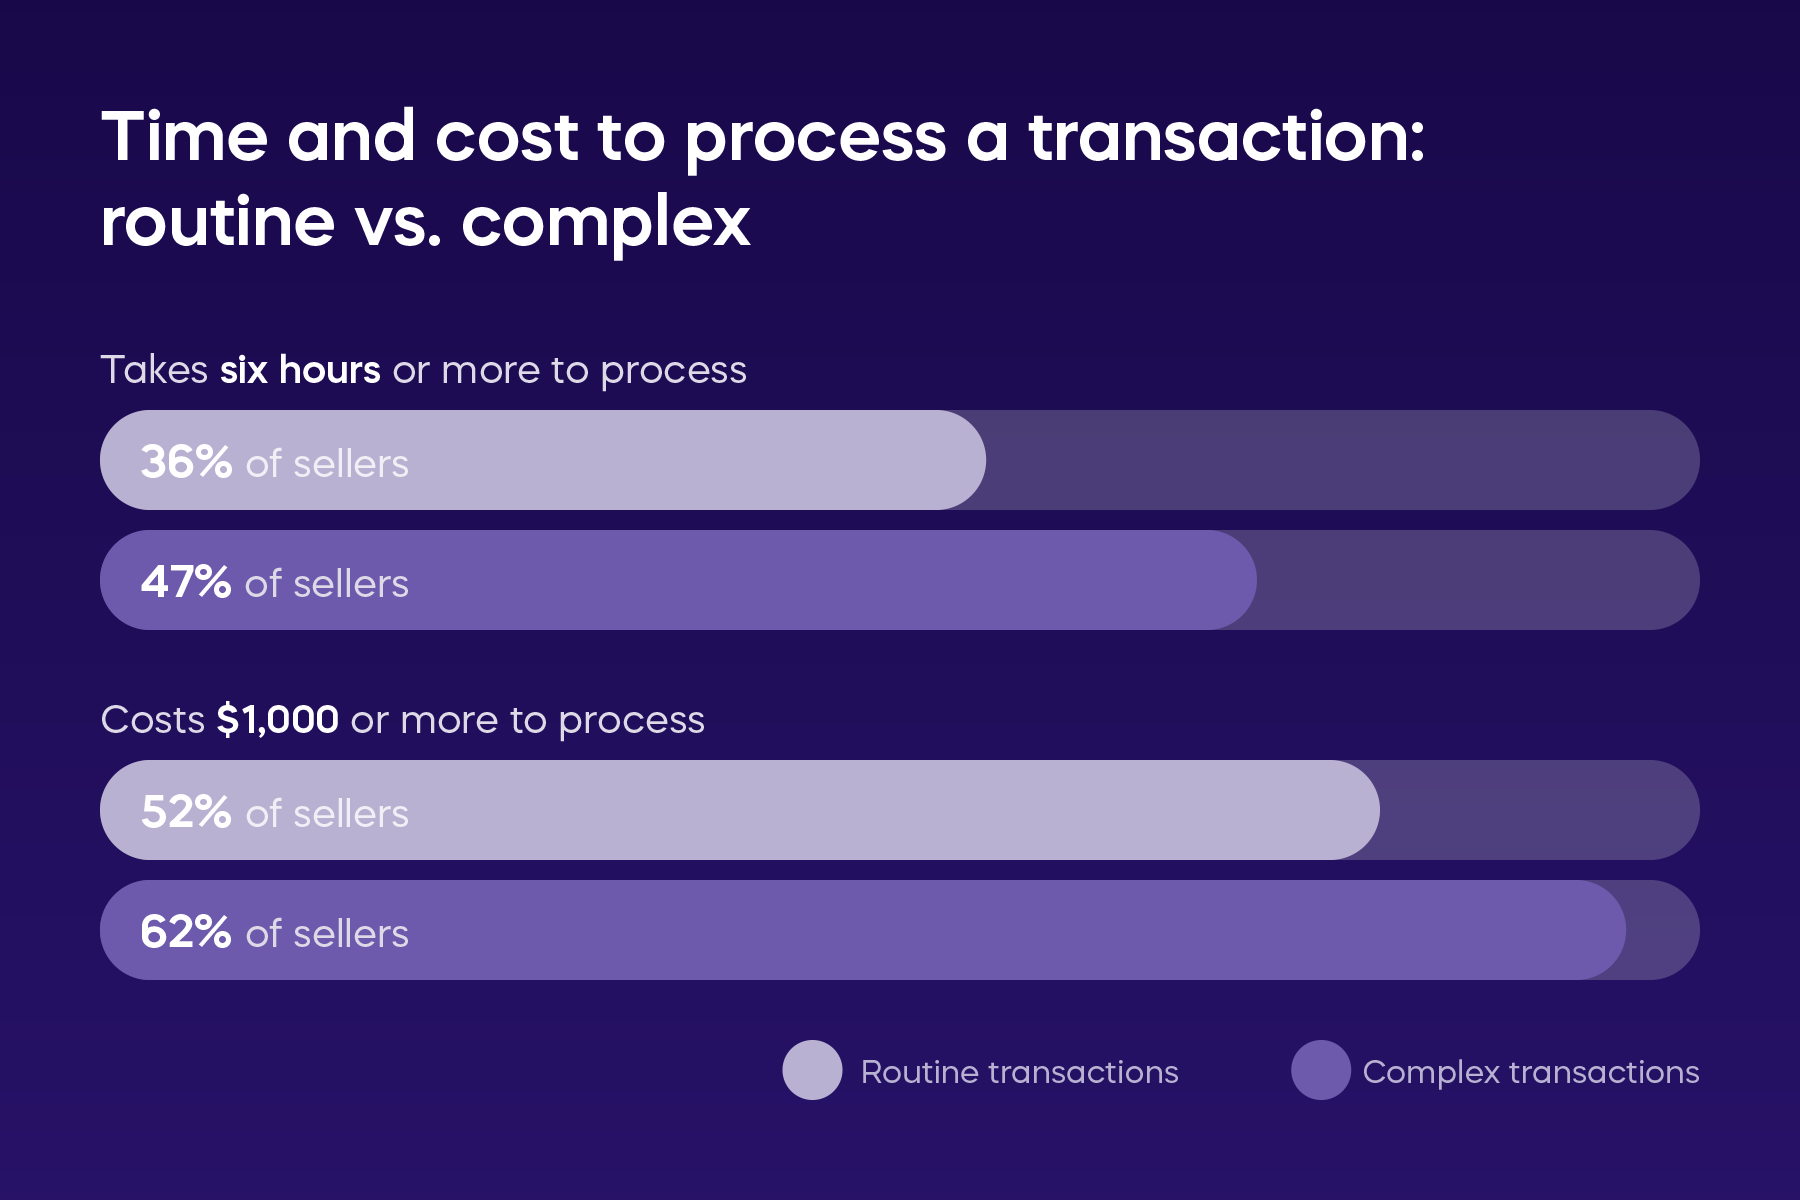
Complexity costs more time and money to process — just not as much as you'd expect.
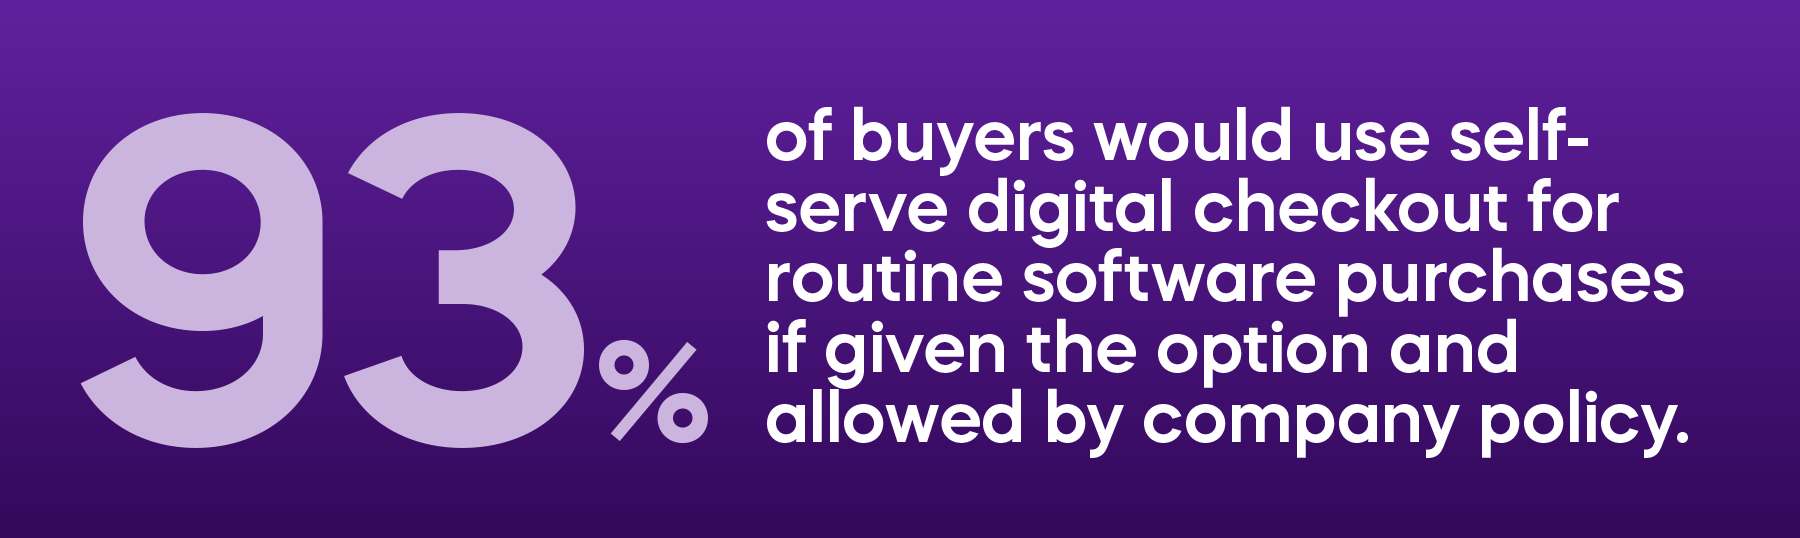
If given the option, 93% of buyers would use self-serve digital checkout for routine software transactions. Buyers and sellers are almost identically aligned on where the market is headed: 95% of buyers and 96% of sellers agree that new purchases, routine renewals, and low-complexity expansions will increasingly move through self-serve digital channels.
Execution has not caught up to conviction. Only 17% of sellers say they have a meaningful self-serve path in place at scale. And buyer demand does not mean buyers invariably want to go it alone: more than half still want a human involved for large multi-year agreements, security/compliance review, procurement exceptions, or complex configurations.
How does your company compare?
Every business sells differently. If you want to see how your revenue band, software category, GTM model, or buyer segment compares with the benchmark, Cleverbridge can provide a custom view of the data.
Custom cuts are subject to data availability, sufficient sample size, and review.
The data points to a practical recommendation: route transactions based on complexity and cost-to-serve, not by defaulting to the motion that traditionally handled them. Keep high-touch sales and partner support focused on larger new purchases, renewals with exceptions, and negotiated expansions. Give standard renewals, seat additions, upgrades, and smaller new purchases a more efficient digital path.
Buyers are asking for it. Sellers agree that it's coming. The opportunity now is to close the execution gap — giving routine revenue a lower-cost digital path while keeping people focused on the transactions that actually need them.
Explore the findings
Get your copy of The Cost of Selling Software. Free to anyone — no email or form required.
Methodology: Cleverbridge partnered with Ascend2 Research to survey 608 B2B software sellers and 551 software buyers across the United States, Canada, the United Kingdom, Germany, India, and Australia in March and April 2026. All findings are reported at a 95% confidence level. Where questions allowed multiple responses, totals may exceed 100%.